An image to PPT conversion is only worth keeping if the numbers stay typable, and a data table is where that most often breaks. For a data table in the original image, or any grid divided into rows and columns by horizontal and vertical lines, the model is required to output a table element: the outer box position plus the number of rows and columns and the cell content row by row. On export it becomes a single native table in PowerPoint, where you can edit text, adjust column widths and add rows directly. If the model pieces together a grid from lines and scattered text, the integrity check and the visual recheck record it as a "Shape approximation" issue. When a .pptx is imported, its tables also become table elements. The sections below cover the content format, decomposition requirements, validation, export, checks, editing, fact check and import, followed by the current limitations.
How to convert an image of a table to PPT in this pipeline
People searching how to convert an image of a table to PPT usually want one thing: a grid they can retype, not a picture of a grid. That is what the requirement below buys. The model returns one table element — outer box, row and column counts, and the cell text row by row — and export writes it as a single native PowerPoint table. Rows and columns are then editable in place, and how to convert an image of a table to PPT stops being a manual redraw.
Table settings
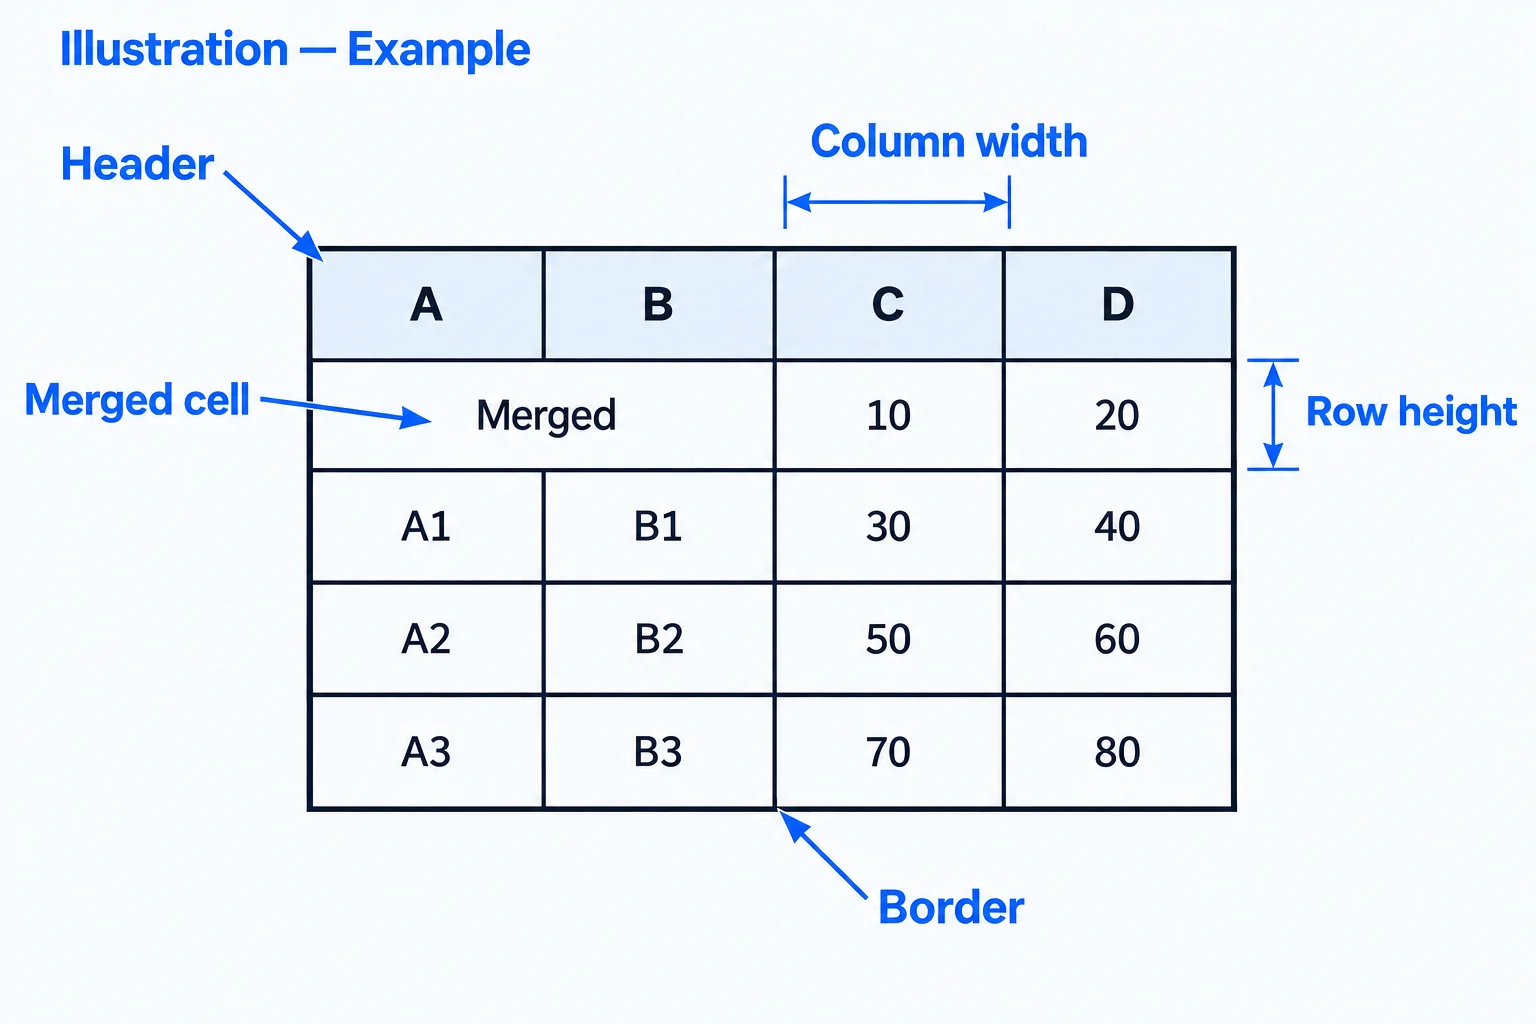
The outer box is given by its top-left corner, width and height, in pixels of the original image. The table itself has these settings:
| Setting | Description |
|---|---|
| Rows, columns | Required, 1–75 each |
| Cell content | Required, row by row; each cell can be plain text or have its own style |
| Column widths, row heights | Optional, distributed proportionally across the width and height of the outer box |
| Borders | Optional: color and width, applied to all borders or only to the vertical lines between columns; can also be set to no borders |
| Header row | Optional, marks the first row as a header |
Each cell can have: text, bold, font size, text color, horizontal alignment (left, center, right, justified), vertical alignment (top, middle, bottom), fill color, and merging (number of columns and rows spanned). Positions covered by a merged area need no content.
For example, a three-column quarterly table: the first row is the title "Fiscal 2026", centered and spanning 3 columns; the second row is "Quarter, Revenue, Profit"; the third row is "Q1, 100, 20", with the numbers right-aligned.
Decomposition requirement: one table, not pieced-together lines
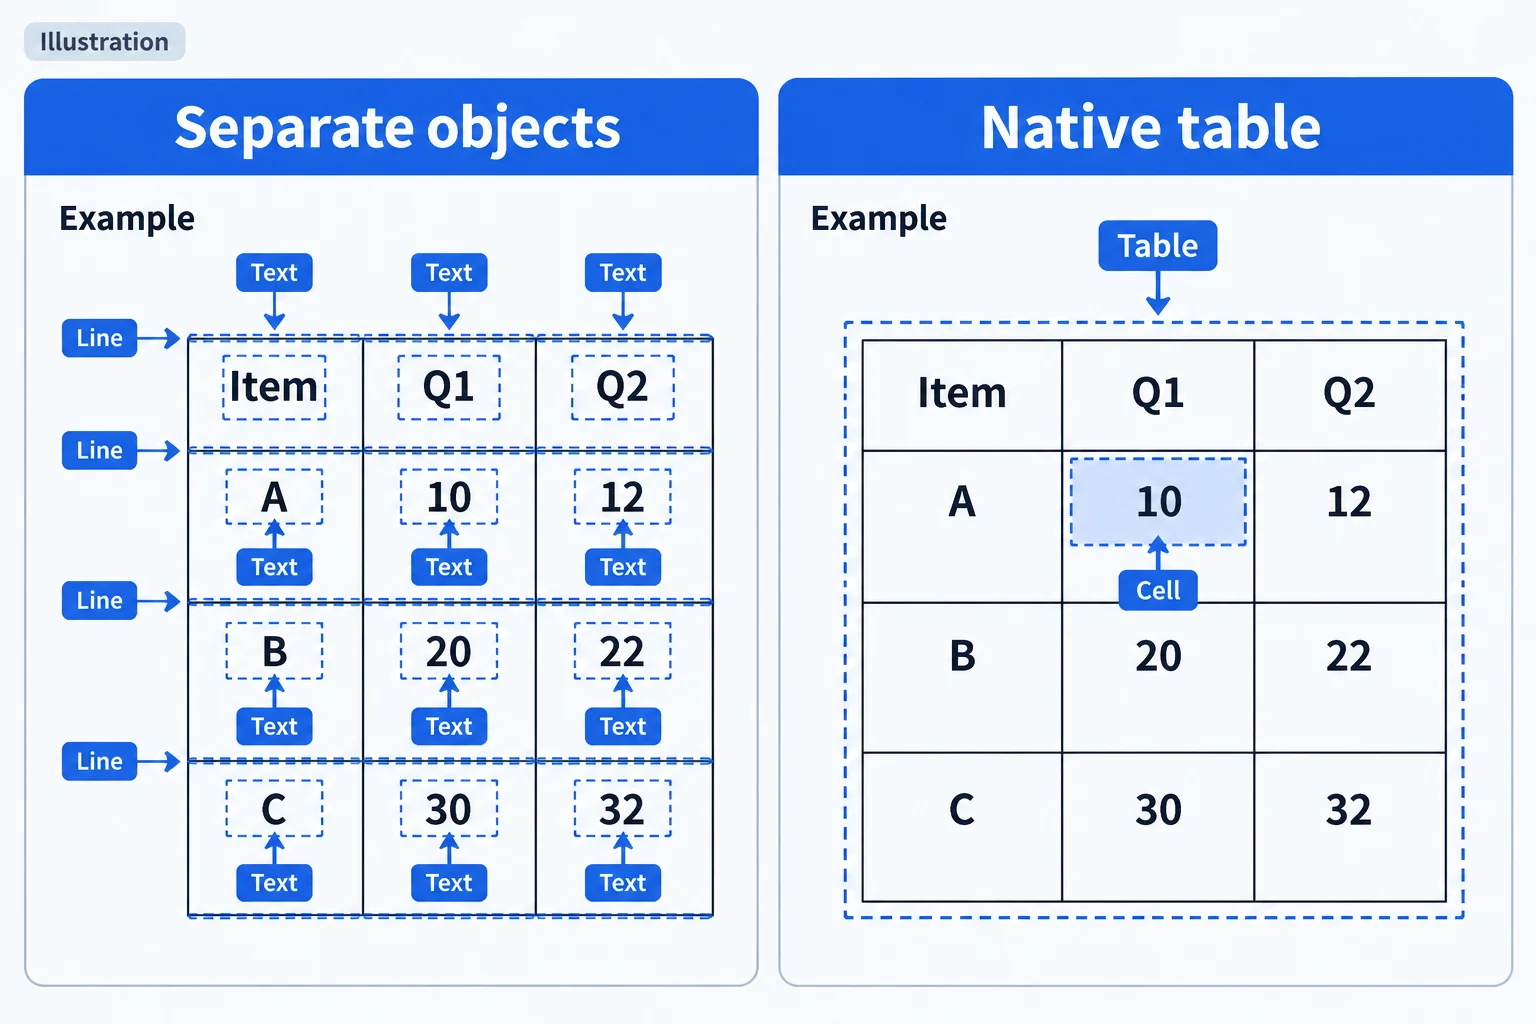
The decomposition prompt specifies: whenever the image contains a data table or any grid with row and column lines, output one table element with the real rows, columns and cell content; do not piece the grid together from rows of lines and scattered text. The same passage requires table cells, like chart bars, to keep square corners. The imageToEditablePPT-Agent prompt has the same requirement.
The reason image to PPT needs one table element: a grid pieced together from lines is dozens of unrelated connectors and text boxes in PowerPoint. Changing a number means finding the right text box first, adding a row means moving every line, and column widths do not line up. A native table is a single object, and text stays with its cell. After export, the whole table is a single table object on the slide, which is covered by automated tests.
Validation
A table must pass these checks before it is saved:
- Rows and columns are integers from 1 to 75.
- Cell content is arranged row by row, each row a list of cells. A cell can be empty, text or a number, or a styled cell. Styled cells accept only the settings listed above.
- Each cell holds up to 2000 characters; colors must be valid hex colors; merge spans must be positive integers.
- Border width is 0–200px.
Parts of the outer box outside the canvas are pulled back inside it. A table without a name is called "Table" by default.
Two cases are not treated as errors and are handled automatically on export: when the number of cells does not match the rows and columns, extra cells are dropped and missing ones are filled with blank cells; when the number of column widths or row heights does not match the columns or rows, they are distributed evenly instead.
Export as a native table
On export, each table element becomes one native PowerPoint table — the part that makes an image to PPT result editable instead of decorative:
- Column widths and row heights are distributed across the outer box according to the given proportions.
- Cells are filled in row by row. Merged cells are written the standard PowerPoint way, with spans reaching at most to the right and bottom edges of the table.
- The text of each cell is one paragraph in Arial, 24px (18pt on export) when no font size is set, vertically centered by default. With a header row, the first row is bold with a light blue-gray fill by default; a cell's own bold or fill setting takes precedence.
- Without border settings, a uniform dark gray 1px border is used; with no borders, none are drawn. With vertical lines only, lines are drawn only between columns.
All colors and borders are written directly on the table and do not depend on the table styles of the PowerPoint theme, so changing the theme does not change the table colors. The export of merged cells and the rejection of more than 75 rows are covered by automated tests.
Live preview
The canvas on the review page draws tables live, expanding merged cells the same way as the export. As soon as the model finishes outputting a table element, it appears on the canvas. The screenshot used by the visual recheck also comes from this canvas.
Integrity check and visual recheck
The integrity check and the visual recheck use the same checklist. The "Missing element" item lists table lines as commonly missed content. The "Shape approximation" item requires a data table with table lines to be a single table element; if it was pieced together from rows of lines and scattered text, it is reported under this item.
Issues with severity "High" that point to a specific element are fixed automatically, one element at a time. A table pieced together from lines consists of dozens of elements, which is a structural issue a single-element edit cannot handle. To replace it with one table, hand it to imageToEditablePPT-Agent: a single change can delete the old elements and add a table at the same time (see chapter 05). If the chat does not name specific elements, the deletions and additions are listed first and take effect only after you confirm them.
Element list and chat edits
The Element list shows a table as "Table". The position and size inputs in the list are currently available only for boxes, ellipses and text; in the list, a table can be confirmed or deleted. There are two ways to edit a table:
- Single-element chat: select the table and describe the change, such as changing a number or adding a row. The model returns the whole edited table, which takes effect after validation.
- imageToEditablePPT-Agent: describe the change in the chat; suited to adjustments that involve several elements at once.
"Tidy up" aligns and arranges a table as a whole and does not adjust the rows and columns inside it.
beautyPPT-Agent fact check
When beautyPPT-Agent redesigns a slide, it can turn a table into a chart drawn with shapes and text, but the numbers must stay the same. The server compares the numbers on the original slide and in the design option with fixed rules, without relying on the model: it reports numbers that are new in the design option and numbers missing from the original slide. Before comparing, it normalizes full-width and half-width characters, thousands separators and Chinese units such as wan (10,000) and yi (100 million), so a number that is only written differently is not reported. If a design option contains numbers that are not on the original slide, you need to confirm before it can be applied.
Numbers in table cells take part in this check in the same way as numbers in text elements, and they are also given to the model as original slide text. This is covered by automated tests: a design option that drops numbers from a table is reported as missing them.
Tables in imported .pptx files
When a .pptx is imported, its tables become table elements by these rules:
- Rows, columns, column widths and row heights come from the grid lines of the original table. Tables with more than 75 rows or 75 columns are not imported, with the note "Tables with more than 75 rows or columns were not imported".
- Merged cells are kept.
- Cell text keeps multiple lines. Color, font size and bold come from the style used by the most characters in the cell, and alignment from the most common one. Italic and font are not carried over. Cell fill colors are kept.
- The whole table uses one border style: the line color and width of the first cell with a border. If the original table has no borders, none are drawn. Imported tables have no header row.
- Rotated tables are made horizontal, and right-to-left tables are imported left to right; both cases are written into the conversion notes.
These conversion rules are covered by automated tests: after exporting a table to .pptx and importing it again, the outer box is within 1px of the original and the cell text is identical.
Current limitations
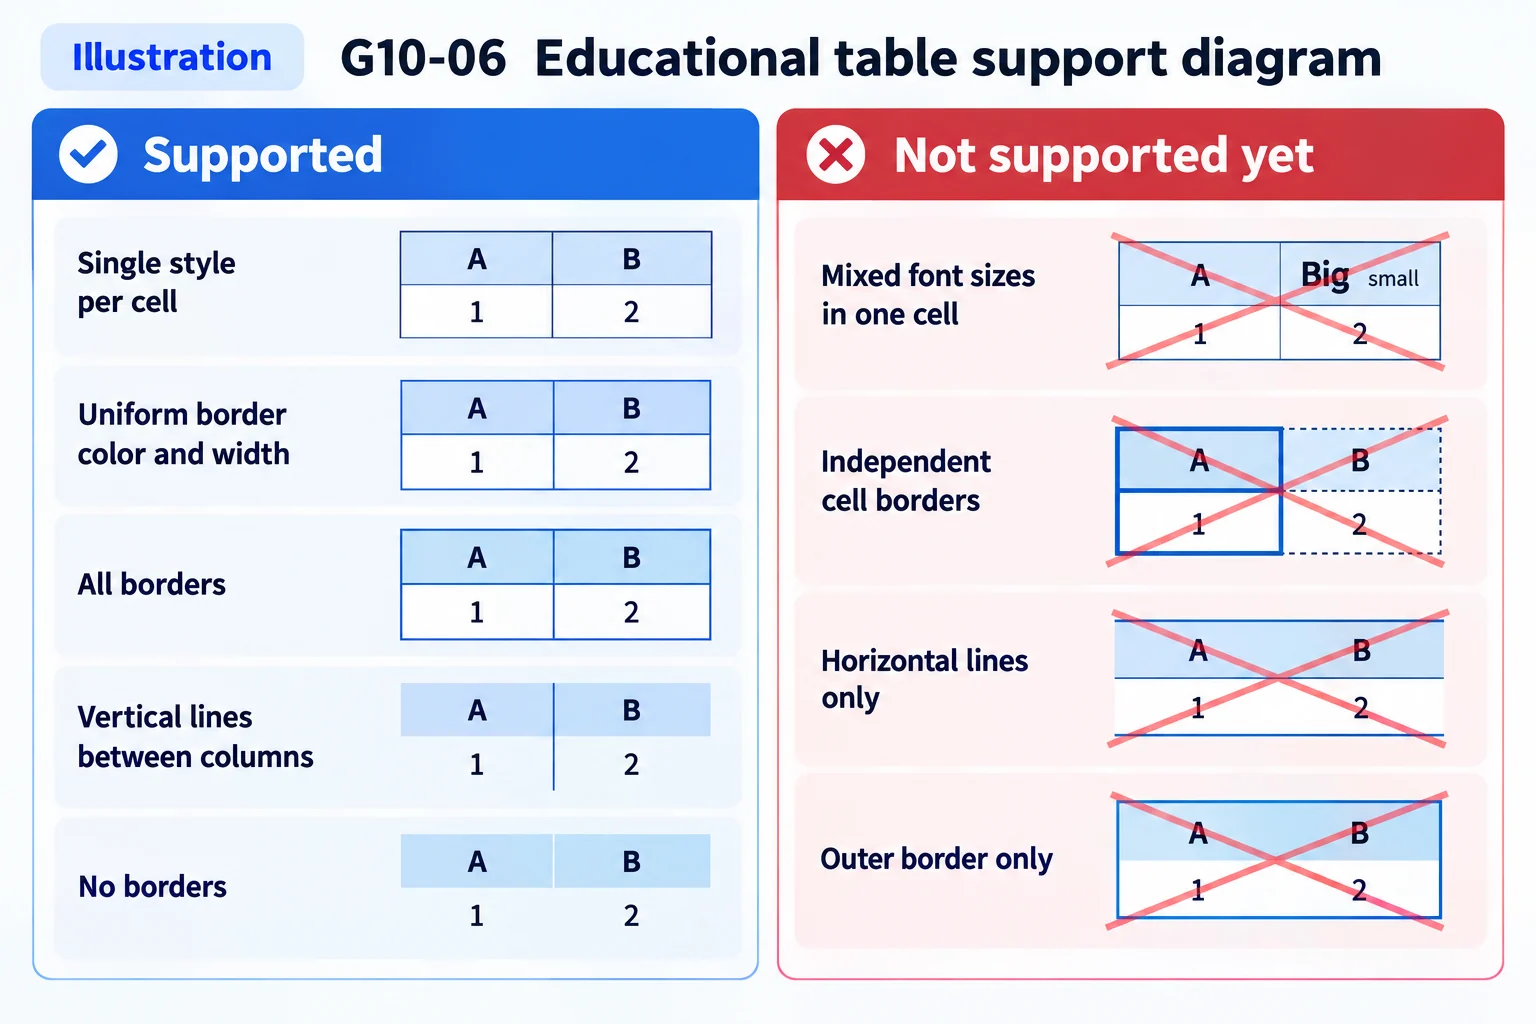
- Each cell has a single style: one cell cannot mix colors or weights. Italic, underline and font choice are currently not supported (export always uses Arial).
- Borders apply to the whole table only: one color, one width, and only two scopes, all borders or vertical lines between columns. Borders for individual cells, horizontal lines only or outer border only are currently not supported, and there are no dashed borders. On import, different borders on different cells are merged into one.
- Cell padding is currently not supported; export uses the PowerPoint defaults. To adjust it, change it in PowerPoint.
- The Element list cannot change the position and size of a table directly. Change them through the chat, or adjust them in PowerPoint after export.
- Tables with more than 75 rows or 75 columns are rejected during decomposition and skipped during import.